More Than a G-Meter: The New Radiant G-Meter Adds Tilt, Altitude Trends, and a Lot More Fun
- James Wiebe

- May 31
- 8 min read
Pilots love information. Not just the required information, but the extra little pieces of data that help tell the story of a flight: How smooth was that turn? How much G did that pull create? How much pitch did the aircraft see? How much altitude did we gain over that ridge? Was that landing as smooth as it felt?
That is where the new Radiant G-Meter becomes especially interesting.
The latest G-Meter is no longer just a simple vertical G display. It is now a compact G / tilt / altitude advisory instrument that gives pilots a vivid, real-time look at several things happening in the aircraft. It shows vertical G load, peak G history, roll and pitch information, altitude change, ambient temperature, and inclinometer information, all on a small color LCD.

For experimental, ultralight, and Light Sport Aircraft pilots, the new G-Meter is both practical and fun. It gives you more ways to understand what the aircraft is doing, while also adding a bit of cockpit curiosity to every flight.
Why G information matters
A G-meter helps indicate the load experienced by the aircraft and its occupants. In normal straight-and-level flight, the instrument will typically sit around +1 G. During turns, pull-ups, bumps, turbulence, or abrupt maneuvering, the G load changes.
Seeing that number in real time is valuable because it turns “that felt like a lot” into actual information. The new G-Meter shows current G, maximum positive G, and minimum negative G. That means you can review the peak values after a maneuver, a bumpy stretch, or a flight segment.
For pilots who enjoy improving technique, this can be very useful. Smooth flying is not just about how it looks from the outside. It also shows up in the G trace. A smoother pilot will generally create fewer abrupt changes. A rougher surface, stronger turbulence, or less coordinated control input will usually show more movement on the display.
The G-Meter does not replace certified instrumentation, and its red thresholds are display cues only, not aircraft structural limits. But as an advisory tool, it gives pilots a quick and interesting window into the loads they create and experience.
Eight screen views instead of one
One of the biggest changes in the new G-Meter is the addition of eight selectable screen views. Instead of being locked into a single G display style, the pilot can press the Right button to cycle through different modes.
The eight views are:
8G-METER — a wide vertical G strip chart
HARSH — a high-resolution ride harshness chart
Dial — a traditional round G-meter display
TILT — a roll and pitch display
±250 FT — a fine altitude trend graph
±1000 FT — a medium altitude trend graph
±2000 FT — a wide altitude trend graph
Inclinometer — a ball-in-bowl lateral balance display
This is what makes the new unit feel less like a single-purpose gauge and more like a small motion-awareness display. You can use it to watch G loading, compare ride quality, check roll and pitch, follow altitude trends, or view a familiar ball-style inclinometer display.
The 8G-METER view: classic G tracking with a modern trace
The 8G-METER screen is the main wide-range G display. It plots vertical G across a ±8 G range and keeps important values visible: maximum G, minimum G, current G, and temperature.
One of the nice technical touches is that the trace is drawn as a thicker min/max ribbon rather than only a tiny single-pixel line. That makes bumps, spread, and motion easier to see at a glance.
For pilots, this view is useful during maneuvering, turbulence, testing, or any flight where you want a quick record of G activity. If the flight was smooth, the trace will usually show it. If the aircraft hit bumps, saw abrupt control inputs, or experienced stronger loading, that becomes visible too.
HARSH view: see the bumps you usually only feel
The new HARSH view is one of the most interesting additions.
A normal wide-range G display is great for big G changes, but small bumps can be hard to see on a large ±8 G scale. HARSH mode solves that by using a higher-resolution vertical G chart centered around a normal +1 G cruising baseline.
That makes ordinary motion easier to notice. Small jolts, runway roughness, taxiway bumps, airframe vibration, off-airport surface changes, and general ride quality become more visible.
For pilots who fly from grass strips, backcountry areas, rougher taxiways, or experimental aircraft test profiles, this can be especially fun. You can compare one runway to another. You can see whether a change in mounting reduces vibration. You can compare smooth air to bumpy air. You can even use it after a flight as a conversation starter: “That bump on climb-out? Here it is.”
HARSH view also shows peak roll, peak pitch, peak G, and temperature, giving you a compact snapshot of what the aircraft experienced.
Dial view: familiar round G-meter style with a digital twist
Pilots like familiar instruments, and the new G-Meter still includes a traditional Dial view.
This screen presents vertical G on a circular scale from -2 G to +5 G. It gives the familiar look of a round aviation G-meter, but with a modern feature: a persistent needle-tip trail.
As the needle moves, the display leaves a small trail of where the needle has been during that dial-view session. A tight group near +1 G suggests smooth operation. A wider spread, a fan of marks, or a lone dot away from the center can show a bump, jolt, or maneuver history.

That little trail is a great example of what makes the new G-Meter fun. It does not just show the current number. It helps visualize what happened moments ago.
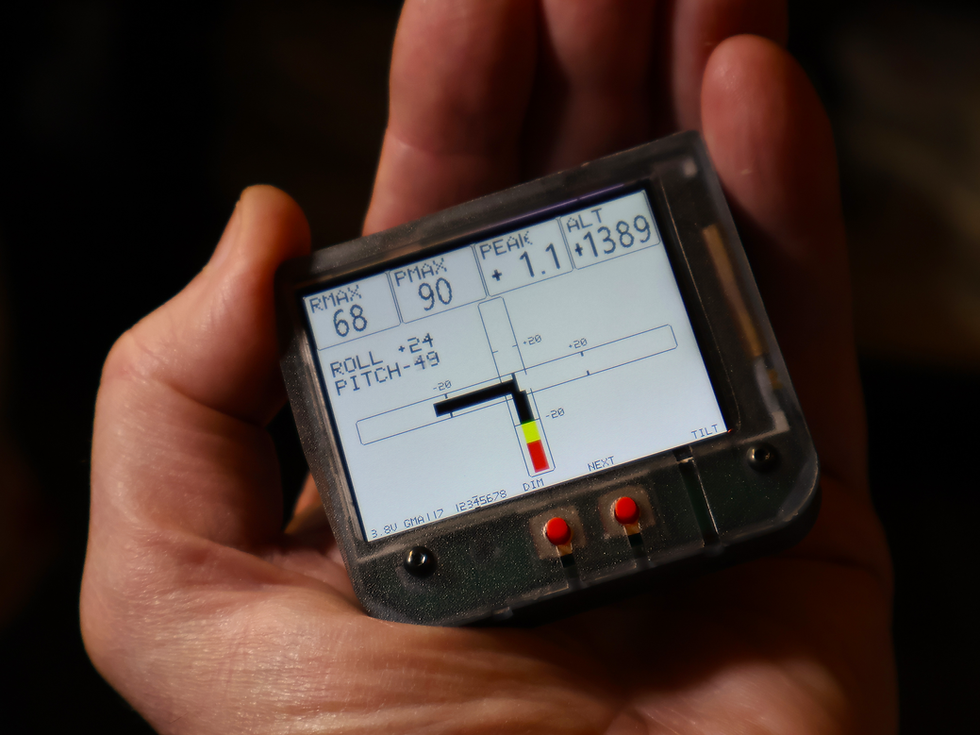
TILT view: roll and pitch at a glance
The new TILT view shows roll and pitch on a cross-style display. Roll and pitch are displayed across a ±45° range, with caution and danger display zones.
For pilots, this is a simple way to see attitude-related motion from the G-Meter’s internal sensors. It is not a primary attitude indicator, and it should not be treated like one. But as an advisory display, it is interesting and useful.
The screen can show how much roll or pitch the aircraft has seen, and it records peak absolute roll and pitch values. That can be useful for pilots who enjoy reviewing flight behavior, testing setups, comparing maneuvers, or simply seeing how the aircraft’s motion looks from a sensor’s point of view.
It is also valuable as a reminder that the G-Meter is now more than a G-only instrument. It can help visualize the aircraft’s motion in multiple dimensions.
Altitude trend views: three scales for barometric change
Another major addition is the set of three altitude graph screens:
±250 FT for fine local altitude changes
±1000 FT for general terrain and pattern-size trends
±2000 FT for larger climbs and descents
These altitude views are based on the internal barometric pressure sensor. Each graph centers on the current altitude when that view is entered, then plots altitude change over time.
For pilots, this is interesting because it gives a simple visual history of climb and descent trends. The ±250 ft view can show smaller changes in a local area. The ±1000 ft view is useful for broader movement. The ±2000 ft view gives a wider picture for larger altitude changes.
The ALT value can also be zeroed for the current session by pressing both buttons at the desired reference altitude. From there, the display can show altitude difference from that reference.
This is not a certified altimeter, not GPS-derived, and not terrain-aware. It should not be used as primary altitude information. But as an advisory trend display, it adds a genuinely useful layer of information in a small package.
Inclinometer view: a familiar ball-style display
The new Inclinometer view is a ball-in-bowl style lateral balance display derived from the internal accelerometer.

For pilots, the concept is familiar: a ball-style reference can provide a quick cue related to lateral balance or slip/skid awareness. The G-Meter’s inclinometer view is not a turn coordinator and does not show yaw rate, but it gives a simple advisory ball display that many pilots will immediately understand.
Another useful detail is that the lateral zero can be recalibrated. After changing the mounting orientation, the pilot can recalibrate the ball / lateral reference so the display better matches the installation.
This makes the G-Meter more flexible as a portable instrument. It can be moved, mounted, and adjusted for different setups, as long as it is installed securely and used within its advisory purpose.
The technical details pilots will appreciate
Under the hood, the new G-Meter uses a solid-state accelerometer for G load, roll, pitch, and ball information. The accelerometer is configured for a ±8 G range, which supports the wide-range 8G-METER display.
Altitude and temperature come from an internal barometric pressure / temperature sensor. The altitude display is barometric, meaning it can be affected by pressure changes, cabin pressure, airflow, temperature, and other real-world conditions. That is why it is best understood as an altitude trend and reference tool, not a certified altitude source.
The display is a 320 × 240 color LCD, which allows the unit to show strip charts, a round dial, a tilt cross, altitude graphs, and an inclinometer bowl instead of only numbers.
The unit also includes:
Live battery voltage on the bottom strip
Bright / dim display control
Paper / inverse display mode
Context-sensitive button actions
Peak reset functions
Session ALT zero reference
Rechargeable internal Li-ion battery
Micro-USB charging
Included convertible clip holster
Approximate 46 gram weight
The Paper / inverse display mode is a nice practical touch. Holding the Left button toggles between the normal display and a paper-like inverse display. In some lighting conditions, that can make the screen easier to read or simply give it a cleaner look.
Small size, big cockpit personality
At approximately 2.44 × 2.24 × 0.48 inches and about 46 grams, the G-Meter is small enough to be a portable cockpit companion, but it now provides a surprising amount of information.
That is part of its appeal. It does not need to dominate the panel. It can sit in its included holster, provide useful advisory data, and add a lot of personality to a flight.
Pilots who enjoy numbers will like the maximum and minimum G readings. Pilots who enjoy smooth technique will like watching the trace settle. Pilots who fly from interesting surfaces may enjoy HARSH mode. Pilots who like gadget-style cockpit feedback will enjoy cycling through the tilt, altitude, and inclinometer screens.
It is practical, but it is also simply fun.
Why it matters
The new G-Meter helps pilots become more aware of motion, loading, and trends. It encourages curiosity. It gives pilots something to learn from after a maneuver, a bump, a climb, or a landing rollout.
That kind of feedback can make flying more engaging. It can help pilots think about smoothness, control inputs, aircraft response, and environmental conditions in a more concrete way.
It also gives experimental and recreational pilots a compact way to add modern display capability without turning the cockpit into a complicated installation project.
The key is to use it for what it is: an advisory instrument. It is not TSO’d, PMA’d, or NORSEE-approved, and it must not be used as a primary flight instrument or required aircraft instrument. But within that role, it adds a useful and enjoyable layer of information.
See more of every flight
The new Radiant G-Meter is still a G-meter — but now it is much more than that.
It shows vertical G load, peak G history, ride harshness, roll and pitch, altitude trend, temperature, and inclinometer readings in a single compact display. It gives pilots more ways to understand what the aircraft is doing and more reasons to enjoy reviewing the flight.
For pilots who like practical data, it is useful.
For pilots who like cockpit gadgets, it is fun.
For pilots who like both, the new G-Meter is right at home.
Radiant G-Meter — see G, tilt, altitude trend, and more.


Comments